Full Mobile Throttle

published on
tl;dr: Being put on "lowered priority to access your network" aka throttling makes for a pretty sad experience of browsing and using the web. Unless there aren't any images involved, which hardly is the case. And it's everybody's job to try to make this better.
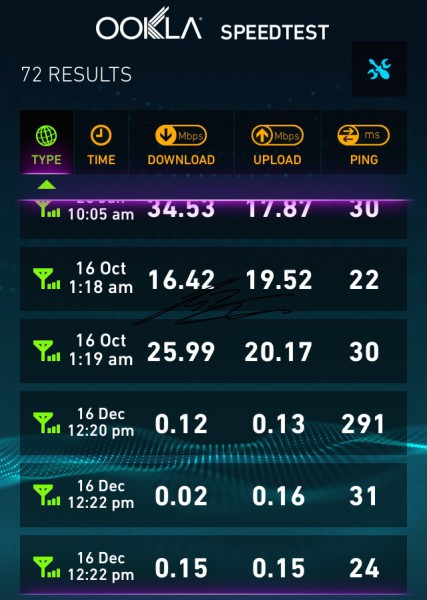
During December a WebRTC video chat sucked up the my remaining 7Gb of my data plan and reached the "fair usage data threshold" and thus the provider "lowered my priority to access the network". I'm not quite sure why they name it like this, but since pictures speak a thousand words, here's a screenshot of what the mystic term "lowered priority to access the network" actually means:
To translate the above download speeds to some reference points:
0.02 mbps = 20 kbps
0.15 mbps = 150 kbps
|
|---|
|
|
|
|
From the above screenshot we can see: Download speed is very slow, somewhere in between GPRS and EDGE for most of the time. December 16th was the day I got throttled, the readings above show the connection speeds I usually get to enjoy.
So out of curiosity about how this actually affects real-life usage and browsing experience, I ran some tests on a few sites, since as you probably can imagine, took quite some time to load.
This shall not be a comparison between sites saying one is better than another, they all have different requirements, serve different content and so on. It’s more to be seen as a showcase about what happens to your browsing when you’re throttled like this.
I picked sites that have somewhat a reputation for caring about performance, might be part of your daily use just by random choice.
These sites have all been tested with their 'desktop’ versions with a MacBook Air late 2011 tethered to my throttled phone data connection. I wanted to actually try it from the mobile, but couldn't get the iOS Remote Proxy to work properly. In this case, load times have been calculated from window.chrome.loadTimes() in Chrome. Furthermore, all sites have been tested from Hong Kong, which might slightly slow things down, since I believe sites to be faster from Europe or even within the US, because I can see a difference quite frequently.
I was mainly interested in how long it takes until you get to actually see something on screen and can start reading, rather than the full load times. Unfortunately for some of the tests firstPaintTime and/or finishLoadTime wasn’t recorded correctly which I didn’t notice at that time and thus aren’t available. I wanted to recreate the conditions by throttling the connection with Network Link Conditioner, but I somehow feel it doesn’t create the exact same conditions.
Here are the results from the sites I have correct data from. Unfortunately it’s also only one recorded result each, but I’m intrigued to go into throttle mode once again to make these tests more extensive. As I said before, these values should rather be seen as approximate, since depending on the throttled network, results might vary over the course of a day.
| smashingmagazine.com |
|---|
|
|
| creativebloq.com |
|
|
| etsy.com |
|
|
| lonelyplanet.com |
|
|
|
| cathaypacific.com |
|
|
| lufthansa.com |
|
|
| united.com |
|
|
| bostonglobe.com |
|
|
| lanecrawford.com |
|
|
The one thing I noticed was that smashingmagazine.com was blazingly fast for every time I loaded it and that was so much faster than any other site. Remarkable job and well done :) For all others, and there have been some sites I just tried or even while surfing around while throttled, the web can turn into quite a painful thing unless there are no images involved; which is quite a rare case.
The throttling might be just an edge case, but it’s great to see if things work ok-ish under these conditions, because then it’s probably a great (or rather fast) experience when you’re on a fast connection. I’m glad to see so many people out there working hard on improving site performances and developing better performance tooling. But in the end it’s all of us who have to make a lot of smart and educated decisions about when to load what and how much of it, so we can improve not only our, but every user’s life. Because not everyone has the privilege of being on a broadband connection every single day. Yet.